


MarketAtAGlance app for iPhone and iPad
Developer: James Jaffey
First release : 02 Dec 2016
App size: 24.34 Mb
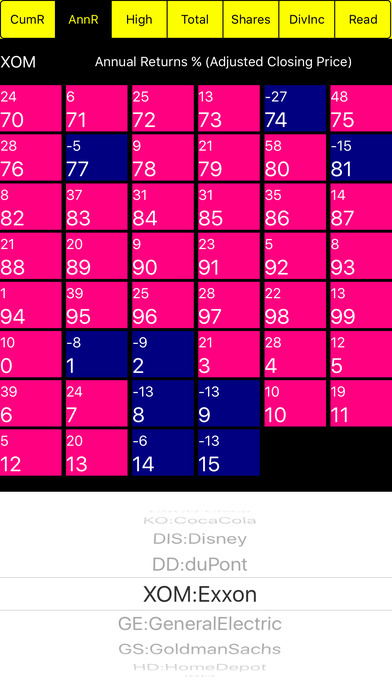
This app analyzes the Dow Jones ETF called DIA as well as the 30 stocks that make up the Dow Jones industrial average. It performs six types of analysis from 1970 to 2016 based on a buy and hold / dollar averaging investment strategy. To use this app, choose an element from the yellow segment bar at the top of the view and a stock from the list at the bottom. Information is displayed graphically with one square available for each year from 1970 to 2016. A purple square means no data is available. Returns are shown in red or blue depending on performance. Red is better. The analysis uses closed data which is adjusted for stock splits between 1970 and 2016. Therefore the price is understated and the number of shares is overstated until all of the stock splits have occurred. The first analysis shows the cumulative return (CumR) from 1970 to the year represented by each square. To choose this first analysis press CumR on the segment bar at the top of the page. The second analysis is the annual return (AnnR) for each year from 1970 until 2016. The third analysis (High) shows annual year high stock prices. The squares representing NEW HIGH stock prices are coloured in red. The fourth analysis shows the value of the portfolio. It assumes that new shares are purchased each yearend in the amount of $5000 plus 2.5% of the current portfolio value. The fifth analysis shows the number of shares accumulated including future share splits until 2016. That number is overstated until the all of the splits have occurred. The sixth analysis shows the ANNUAL DIVIDEND INCOME of the stock being analyzed.